

Every training cycle ends with the same unanswered question: did they master the skill, or merely pass it? The final score says passed, and says nothing about what their hands will do when the moment comes.
What we measure, and when
- Baseline: we record the starting point in numbers before the first attempt, so every later improvement has a reference to measure against.
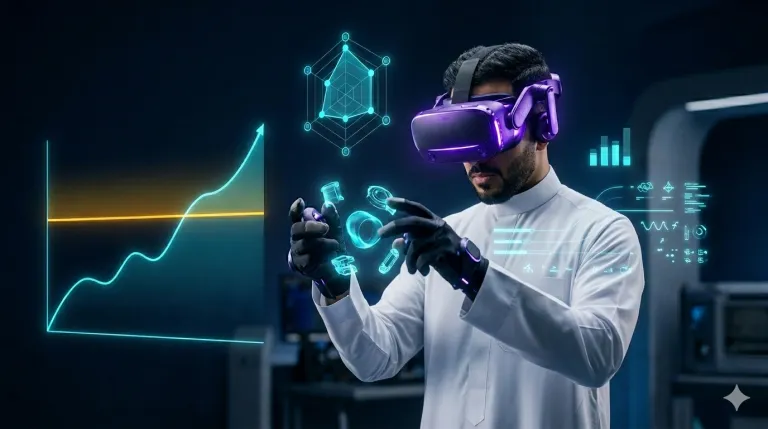
- Live, during performance: compression depth, response time, decision sequence, recovery after error: clinically and professionally interpretable indicators, reaching the trainee mid-performance.
- A curve across attempts: not a single score but a path showing where the trainee began, where they stabilised, and when they passed the level required for the skill (the competency threshold).
From number to proof
A number alone is a claim. Three things make it proof: a competency threshold declared before training, a data-backed mastery report that reads as well in a quality review as in a trainee's file, and a methodology footnote stating how the number was measured, on how many trainees, and when.
That is how we publish everything: when we say 80.9% of trainees described the experience as "far better" than traditional training, the number carries its footnote: Self-assessment survey administered to 47 emergency-response trainees immediately after the session, on the CPR experience applied to Hajj emergency scenarios, 2026 season.
What the institution gains
The analytics dashboard surfaces performance inside the experience, not once it ends. The trainee corrects while learning; the institution walks away with evidence of readiness, reaching the trainee, the training manager, and the decision-maker at once.
Why does immersive simulation get a trainee there faster? That's the first article.